
Editor’s note: This report was authored by by Austin Ritchie and Daxton Wirth This is external threat intelligence from the ReliaQuest Threat Research team. The findings describe threats, vulnerabilities, and attacker activity affecting third parties and the broader threat landscape—not ReliaQuest's own environment. Nothing in this report should be interpreted as a vulnerability in ReliaQuest's systems or data.
Key Points
ReliaQuest investigated an incident in which, for the first time, we identified an open-source AI agent orchestration platform running on the same IP address that launched the attack. We assess with high confidence that AI agents driven by large language models (LLMs) carried out substantial portions of it.
In under 24 hours, the attacker ran hundreds of commands through one exposed application feature and took full administrative control of the compromised server, using no new malware and no zero-day. Agent orchestration removes skilled operator hours as the limiting factor, so one attacker can run more incidents at once.
Require authentication on exposed job-management endpoints and retain their job history—here it outlasted every artifact the attacker deleted.
ReliaQuest recently analyzed what we assess, with high confidence, is the first incident we've seen in which large language model (LLM)-driven agents carried out substantial portions of the attack. This went well beyond an attacker consulting an AI assistant: commands ran, results were evaluated, failures were corrected, and approaches changed as the incident progressed. We could not determine how many agents were involved, which model drove them, or to what degree a person approved individual actions. The orchestrator cannot answer the model question: the tools it drives can front any vendor's model through a proxy, and the actor had one.
In under 24 hours, the attacker used an exposed application feature to steal credentials and gain control of a server. The attacker's infrastructure pointed to Cairn, a legitimate open-source orchestration platform for coordinating AI agents on multi-step tasks. Its presence on the attack-origin host, together with the command sequences and repeated corrections, underpins our assessment that the workflow was largely agent-driven.
The techniques themselves were familiar; what was new was the layer above them: sustained, adaptive execution driven by an orchestration framework rather than an operator at a keyboard. For attackers, that lowers the barrier: the stack is assembled from open-source and commercially available parts, and the agents handle the moment-to-moment adaptation that used to require an experienced operator. For defenders, the risk is a workflow that keeps adjusting and advancing with little human intervention. That shifts the burden onto controls that don't depend on an analyst being awake: authentication on exposed endpoints and automated containment.
In this spotlight, we:
Map the infrastructure behind the incident, including a live orchestration panel on the attacking host and the tools staged alongside it.
Trace how the attacker turned a routine job-submission feature into a command channel and worked within a self-imposed 1,800-byte output budget.
Examine the timing, naming, and error-correction indications that separate machine-driven execution from a human operator.
Set out what defenders should change — endpoint exposure, credential hygiene, the telemetry to investigate an incident that never leaves the application process, and why matching agent speed takes automation rather than more analyst hours.
A Live Orchestration Panel on the Attacking Host
The most direct indication tying this incident to AI agents sat on the attacker's own server: a live Cairn dashboard running on the same address that sent the batch requests opening the incident. The dashboard was Cairn's own interface, matching the public project in markup, asset paths, server software, and port, all project defaults. That places an identifiable orchestration interface on infrastructure directly involved in the attack, a stronger link than the AI tools found elsewhere in the same hosting environment.
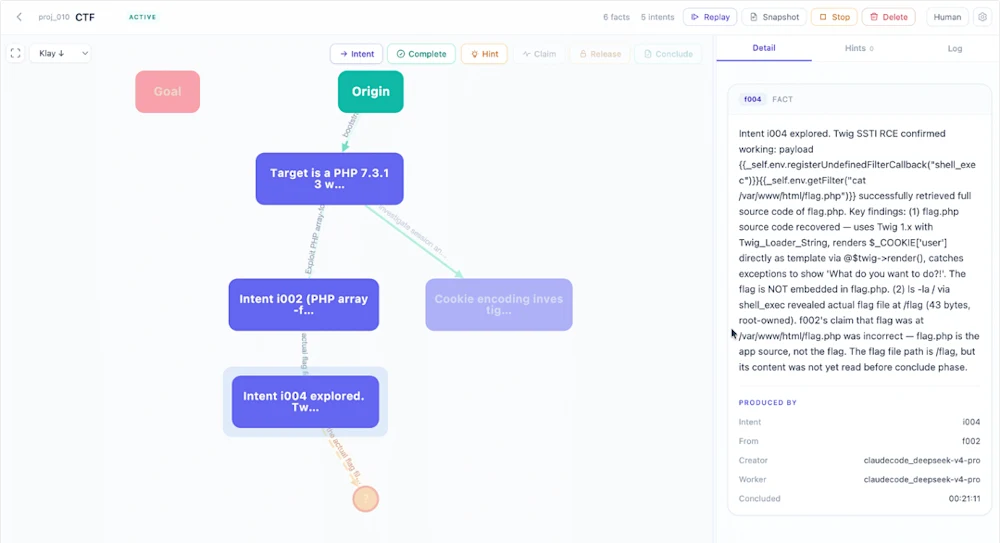
Our infrastructure review identified three attacker addresses, each with a distinct role. The attack-origin host created the malicious jobs and exposed both the Cairn interface and exploitation material. A second had scanned the environment beforehand and held the escalation tools later delivered to it, under the same filenames seen on the compromised server. A third collected job output in bulk.
Attacker Infrastructure
Host #1 — 204.194.55[.]189 | Attack Origin
Identification | Function and Purpose |
|---|---|
Title “Cairn,” served by uvicorn | Orchestration control plane that dispatches AI coding agents against an objective and tracks what they learn. No authentication. |
Codeg (Code generation) | Console for running several agent sessions in parallel. Work is queued and approved by a person, not dispatched autonomously. |
Acunetix | Commercial vulnerability scanner running on two interfaces, handling the automated discovery that precedes exploitation. |
Python BaseHTTP, response body PONG | Fixed-response endpoint, consistent with a reachability check. |
Python SimpleHTTP, open directory | Enterprise-Java and portal archives matching the target's technology class, staged for retrieval. |
Host #2 — 204.194.54[.]240 | Tool Staging, Pre-incident Scanning
Identification | Function and Purpose |
|---|---|
Title “Grok2API” | Proxy exposing a commercial language model through one endpoint, so agents need no vendor credentials of their own. |
Title “CyberStrikeAI,” login page | AI-assisted offensive security platform. Credential-gated, so its capabilities could not be examined. |
Title “Pelican · Pi Console,” nginx and Express | Agent execution console. Cairn dispatches agents through adapters named for Claude Code, Codex, and Pi — an adapter names an interface, not a model. This tier sits beneath an orchestrator. |
Title “Resin · Sticky Proxy Pool” | Rotating proxy pool that varies source addresses while holding a stable session. |
Python SimpleHTTP, open directory | Escalation tools alongside their source directories and base64 copies, showing where they were built and encoded. |
Two open directories tie this infrastructure to the incident. One, on the attack-origin host, held enterprise-Java and portal exploitation material matching the compromised environment's technology class, and it predated first contact. The other, on the second host, held the escalation tools in working form, the source they were built from, and encoded copies ready for delivery. Both point to preparation ahead of target selection, not tools assembled mid-incident. Combined with a console built to run several agent sessions in parallel and a vulnerability scanner on the same host, that preparation points to an operation designed to work through many targets, with this environment as one of them.
Host #2 Open-Directory Files
What’s there | Why it matters |
|---|---|
PrintSpoofer64.exe, GodPotato-NET4.exe | Two public Windows privilege-escalation tools, both abusing the same impersonation privilege to reach SYSTEM. The same filenames seen on the compromised server — a direct link between this staging host and the target activity. |
gpsrc/ pssrc/ | Source directories for both GodPotato and PrintSpoofer. The attacker compiled from source rather than using published releases. |
diag_anycpu.exe diag_fixed.exe diagutil.exe gp_rt.exe | Rebuilds renamed to look like diagnostic utilities. The suffixes are .NET build targets: the same tool recompiled for different architectures. |
hello.cs hello.exe hello.b64 | A trivial program, compiled and base64-encoded to rehearse the delivery chain on a harmless binary first. |
du.b64 du3.b64 du4.b64 | Numbered iterations of base64-encoded payloads, matching the b64 delivery method used against the target. |
The second host’s traffic links it to the incident, but we couldn’t determine whether Grok2API, CyberStrikeAI, or the Pi Console played a part, or how those services fit together. The Cairn panel on the attack-origin host is the only service on this infrastructure we can tie to identified orchestration software. Every component here was open source or commercially available; none of it was custom-built. The assembly is therefore not a fingerprint for any one group, and detections built around this particular combination of services would not survive the next actor assembling a different one.
A third address, 94.177.131[.]113, retrieved job results in bulk and sent requests to the upload endpoint, operating as the collection side of the channel from a different address than the one submitting jobs. Because submission and collection ran from separate addresses, blocking the exploitation source alone wouldn't have stopped retrieval.
What Cairn’s Source Code Explains, and What It Doesn’t
Reviewing Cairn's public source code helps explain several behaviors in the command record that the following sections describe. Its prompts encourage agents to keep working, write bulk data to files and reference those files by pathname, and change direction when an approach stops producing results. All three behaviors appeared in this incident, which fits a platform built to run agents without a person watching.
What the source doesn't contain matters just as much. It implements none of the incident's output wrappers, job identifiers, or chunking logic, so those conventions can't be attributed to Cairn, and artifacts on a compromised host can't be used to fingerprint it. It's a realistic possibility they came from agent-generated code, operator-provided scripts, or a separate customization layer. Either way, defenders should hunt for the behaviors rather than for a Cairn signature.
One Exposed Feature for the Whole Incident
Whatever was directing the attack, every step ran through a single job-submission feature that was reachable without a login. The attacker didn't need a zero-day or a security bypass, just that misconfiguration. From there, they ran JavaScript inside the application, pulled results out through error messages, recovered database credentials, and escalated to full control of the server.
The Exposed Endpoint
The attacker entered through an internet-facing application feature on an Apache Tomcat server that accepted and ran task descriptions without requiring a login. The application used Spring Batch, a Java framework for scheduled bulk processing, in which a task definition names the code that should carry it out. That flexibility was intentional; allowing anyone on the internet to use it wasn’t.
Early probes confirmed the attacker could write files into the application’s folders, but the application account already allowed that, and it wasn't the decisive capability. The key step was submitting tasks that invoked Nashorn, the JavaScript engine available in the application’s Java environment. That code ran inside the application with its account privileges and created no child process, so process-based detection had nothing to key on until the attacker later spawned a shell.
The attacker deliberately triggered errors and used the returned messages to retrieve results, avoiding the need for a web shell or a new process for each action. Each read used a primary method and a fallback, a sign of deliberate design rather than accidental failure. Nashorn errors were almost absent from the reviewed application history before the incident but closely tracked the malicious jobs during it.
Because the error messages could carry little output, the attacker retrieved information in fixed 1,800-byte chunks, reassembling it across hundreds of sequential requests that tracked their position in each file. The pattern reflects the channel's limits rather than evasion: chunk sizes never varied, requests showed no timing jitter, and later in the incident the attacker raised its request size rather than lowering it. Working around those limits produced the chunking, retries, and corrections described later in this report, and how the attacker adapted to them is part of the supporting material behind our assessment of agent-driven execution.
|
Figure 2: Three consecutive jobs from a single file retrieval. The job name carries the byte offset, output is written to a file named after the job, and every request reads the same 1,800-byte slice.
Escalating Privileges to Full Server Control
With code running inside the application, the attacker turned to its configuration files, where a single set of plaintext credentials opened the path to full control of the host. They carried SQL Server sysadmin rights, but database access alone doesn't give an attacker the host. The bridge was xp_cmdshell, a SQL Server feature the attacker enabled to run operating-system commands as the database service account. A privilege check then turned up SeImpersonatePrivilege, and that check was deliberate: enumerating privileges before choosing a technique narrows escalation to what the host will allow. It also explains the two tools staged next, PrintSpoofer and GodPotato, both of which abuse that privilege to run as SYSTEM, the highest-privilege local account on Windows.
The attacker prepared both tools before trying either, building in a fallback from the outset. Both were base64-encoded, uploaded in sequential fragments through the command channel, and reassembled on the host. After repeated file-permission errors placing the first, the attacker switched to the second and gained SYSTEM access. Staging both in advance meant the first failure cost minutes rather than a new round of preparation. Both tools are public and widely signatured, so the escalation activity around them is the better thing to monitor.
With SYSTEM access, the attacker saved the Security Account Manager (SAM), SYSTEM, and SECURITY registry hives, allowing local account password hashes and other stored credential material to be extracted offline. The attacker then created local administrator accounts and, in an attempt to cover their tracks, removed artifacts and disabled xp_cmdshell.
The Indications This Was Machine-Driven
The command record carries patterns in timing, job naming, output formatting, and error correction that point to machine-driven execution rather than a person at a keyboard. No single one establishes that an LLM agent was involved; a human directing scripts could produce several of them. The weight comes from their combination, and from the live Cairn panel on the host that sent the incident's opening requests.
Timing Between Commands
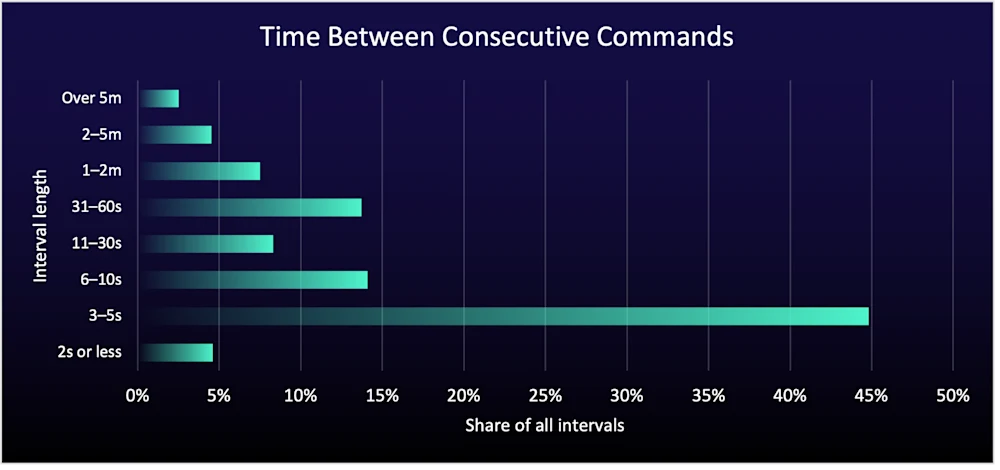
The timing between commands was marked by rapid repetition: roughly half the gaps were five seconds or less, with a median of about six seconds, while about 22% lasted 11 seconds to a minute and 15% exceeded a minute. That concentration of short gaps strongly suggests automated rather than manual submission, though timing alone does not identify what drove the activity. The longer gaps are harder to interpret because the record shows when commands were submitted, not when they finished, so they may include time spent waiting for commands to complete.
Job Names Minted Seconds Before Use
The names the attacker gave their jobs provide strong indications of programmatic generation and state tracking. Every command ran as an application job with a name that tracked progress: for retrieval, the next position in the file; for uploads, the part number.
One retrieval ran for dozens of sequential jobs in 1,800-byte steps; a separate upload ran as numbered parts with none missing or repeated. Hand-built sequences that long usually drop or duplicate a part. Other names embedded timestamps from a few seconds before execution, suggesting each was generated as its request was prepared. And because the application records these names at submission, job history survives after file artifacts are deleted, as it did here.
Pattern | Example job names | What they show |
|---|---|---|
Read offsets | xldap1800, xldap3600, xldap5400 … | Each name tracked the next position in the data, advancing in fixed 1,800-byte steps, with each job arriving seconds after the last. |
Upload chunks | w0…, w1…, w2… | Each name identified a part of the upload. All part numbers appeared in order. |
Clock values | q5063109 (06:31:09) | The embedded time preceded execution by seconds, consistent with a name generated shortly before submission. |
Written for Machines, Not for People
The output was formatted for a program to read, not a person. Records were pipe-delimited and prefixed with a type token, with repeated section banners, an explicit exit code, and line breaks normalized so each record sat on a single line. It was also bounded at every level — fields, rows, exception text, and whole responses each capped — sized to the channel rather than to anything a person would want to read. An agent reading its own output has no reason to disguise it, and formatting like this reflects how the output was used rather than any tool that could be signatured.
|
Figure 4: Lines that produced the actor's output. Pipe-delimited records, typed error prefixes, an explicit exit code, section banners, and a hard row cap.
The payloads show the same absence of a human audience from the other direction. These were single-use scripts, sent through the channel, run once, and never read again — yet they carry comments that explain intent, weigh alternatives, and record uncertainty. Annotation like that pays off when someone reads the code later; here, nobody would. What the comments do instead is narrate the reasoning behind each choice in real time.
|
Figure 5: Comments left in single-use payloads—a rejected option, a justified choice, an untested assumption, a note to revisit, and a library behavior explained to no one.
Each Revision Fixed the Last Error
Near-identical payload pairs recur throughout the record, and the second of each pair repairs the specific fault the first one returned. That's the clearest sign that something was reading the output and acting on it, rather than working from a fixed sequence. The snippets below show one such pair: a loop construct the engine rejected, and its replacement.
Failed Attempt:
|
Fixed Attempt (within the minute):
|
Execution timeouts were set per command rather than fixed, and the highest value in the record follows a run of timed-out reads, consistent with the attacker adjusting to the channel rather than working from a preset.
Objectives First, Concealment Second
The attacker made little effort to hide. They applied no obfuscation, left their output in plain structured text, and worked entirely off the shelf: two public privilege-escalation tools, a public credential and protocol library, and built-in Windows utilities such as certutil, wmic, and PowerShell. What concealment they did attempt came late and covered little. Artifacts were removed only after the actions that produced them completed, the original access path stayed open, and the extracted credentials couldn't be recalled. The attacker created two backdoor administrator accounts and deleted only one of them during cleanup. The deleted account shared its name with a lateral-movement script staged on the same host an hour earlier, a reuse a stealth-minded operator would have avoided. The second account was left in place.
Taken together, this was an operation optimized for finishing its objectives rather than going unnoticed. For responders, that means scoping from the application and job records rather than from what survives on disk.
Step Up Your Defenses Against AI-Driven Incidents
ReliaQuest's Approach
This incident produced a new attacker action every few seconds for extended periods, while much of the initial activity ran inside an existing application process and generated no new child-process telemetry. GreyMatter addresses both the speed of the activity and the resulting visibility gap.
Detection at Source: Job-submission and batch-configuration activity lives in application logs that rarely reach a detection pipeline. Detecting at the source puts that history in front of analysts alongside endpoint telemetry, which matters because the application record outlasted every artifact the attacker deleted.
GreyMatter Discover: The entry point here was a management endpoint left exposed to the internet. Discover finds job-submission, batch-configuration, and administrative surfaces exposed on your perimeter before attackers do.
Detection in Transit: Transit identifies threats in seconds, as telemetry moves from source to storage rather than after it lands, so the response window keeps pace with the attacker instead of the pipeline.
ReliaQuest Detection Rules are continuously updated with the latest relevant threat intelligence and pairing them with the following GreyMatter Automated Response Playbooks helps your organization cut mean time to contain (MTTC) threats to five minutes or less.
Isolate Host: Isolates an application server the moment unauthorized script-engine execution is confirmed, cutting the command channel while preserving job history.
Reset Password: Rotates credentials for accounts exposed in configuration files, shutting down reuse of the specific credential the attacker recovered.
Block IP: Stops known attacker infrastructure, such as the IP addresses observed in this attack, from reaching your environment.
Your Action Plan
Inventory internet-reachable job-submission, batch-configuration, and administrative endpoints. Require authentication and appropriate authorization and restrict exposure wherever possible.
Retain job definitions, execution and step history, exceptions, and exit descriptions alongside web, database, and endpoint logs. Make sure responders can retrieve this history and that it's kept long enough to support an investigation.
Hunt for unusual job volume or sequencing together with unexpected script-engine use, output returned through errors or exit descriptions, and related host activity. Treat cadence as a useful signal, not a standalone detector of AI or incidents.
Audit application configuration files for stored credentials. Rotation alone just reinstates the exposure the next time the file is read; move these credentials to a secrets store or managed identity and restrict any service account that holds database-owner rights.
Key Takeaways and What's Next
This incident shows how agent orchestration changes the economics of an incident. The entry point itself was an exposed application feature, and securing it is a familiar defensive task. What set this incident apart was how persistently the attacker worked through it: job submissions, bounded output retrieval, and rapid corrections carried the whole incident through a single endpoint. The scarce input in an incident like this has always been skilled operator hours, and an orchestration framework dispatching commercial coding agents removes that constraint, which means the same attacker can now work more targets at once. Every technique here was known, and the compromise took just under a day.
Agent-orchestrated incidents will likely increase over the next 12 months, driven by open-source orchestration frameworks that require no custom development and by the falling cost of model inference. Process- and file-based detections may have limited visibility into an incident that begins and remains inside an existing application process. Closing that gap means treating application and job records as security telemetry, not just operational logs.
IOCs
Please Note: These indicators have different evidential roles. Service availability was observed at specific points in time and may have changed since.
Indicators & Observables | Context |
204.194.55[.]189 | Source of requests that created malicious application jobs; also exposed a Cairn interface and exploit-staging material |
204.194.54[.]240 | Sent traffic to the environment prior to the incident; exposed AI-related services and an open directory containing tool-named files matching the incident |
94.177.131[.]113 | Retrieved job output and sent POST requests to the upload endpoint; a relay role is possible but unconfirmed |
/tmp/out_<jobname>.txt | Command output written to a file named after the submitting job |
/var/tmp/.x/ | Dot-prefixed directory holding shell scripts and a private runtime |
/var/tmp/kvragent | Binary dropped on the server and used for scanning |
C:\Windows\Temp\ps.b64 → C:\Windows\Temp\ps.exe | PrintSpoofer: uploaded as base64 fragments through the command channel and reassembled with certutil |
C:\Windows\Temp\gp.b64 → C:\Users\Public\g.exe | GodPotato: uploaded as base64 fragments through the command channel and reassembled with certutil |